Product — Fuel Station Management System
SentinelLive
Your entire station. On one screen.
- apps, one desktop
- 32apps, one desktop
- operational areas
- 8operational areas
- of data stays on site
- %100of data stays on site
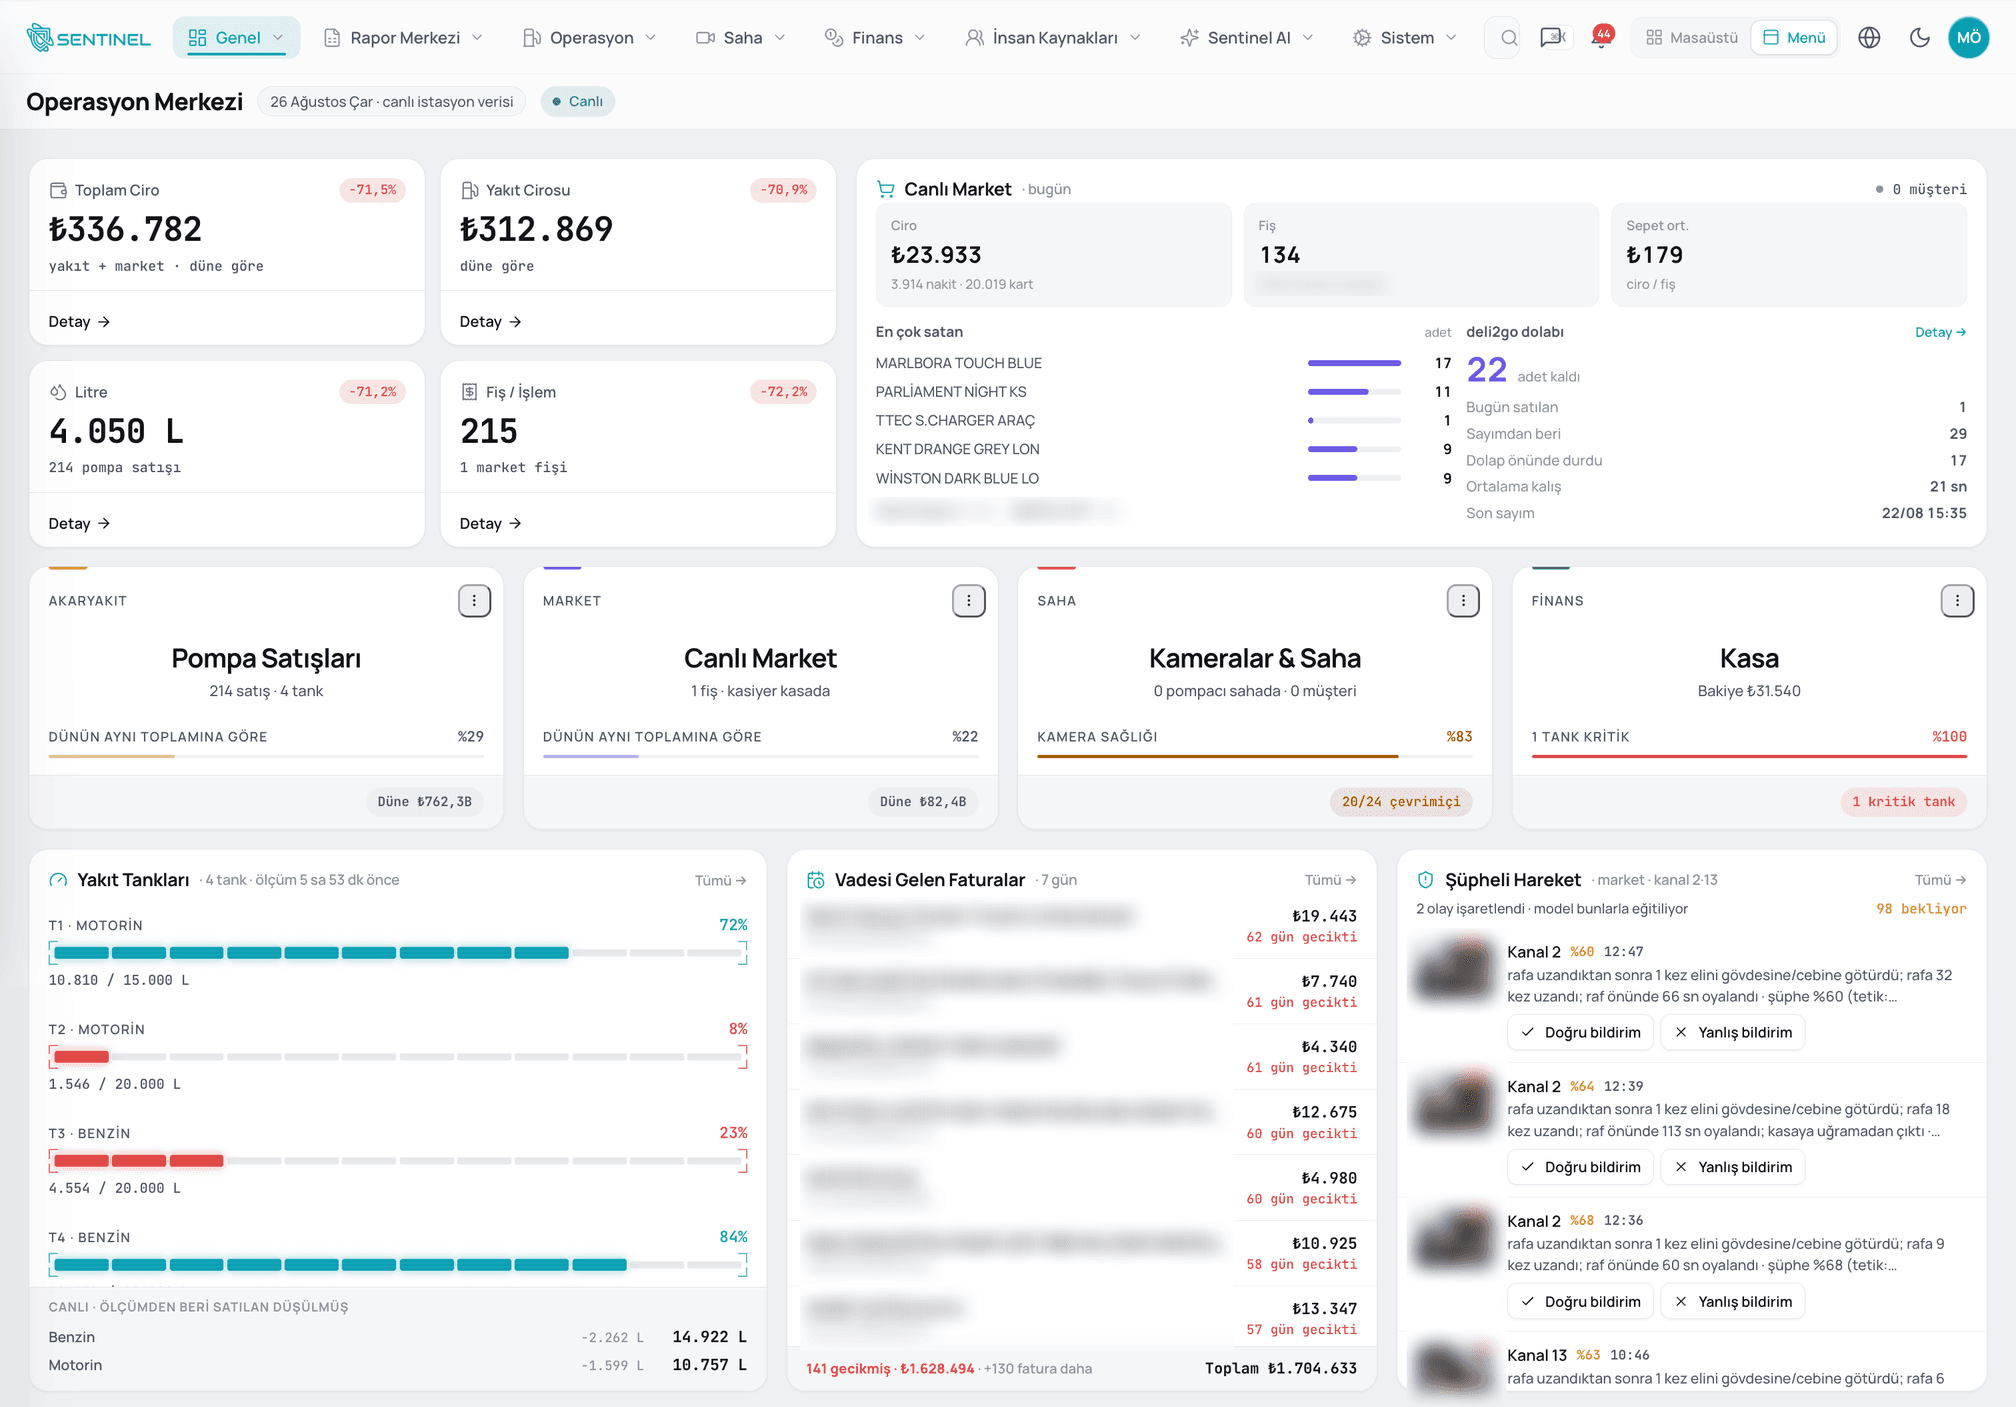
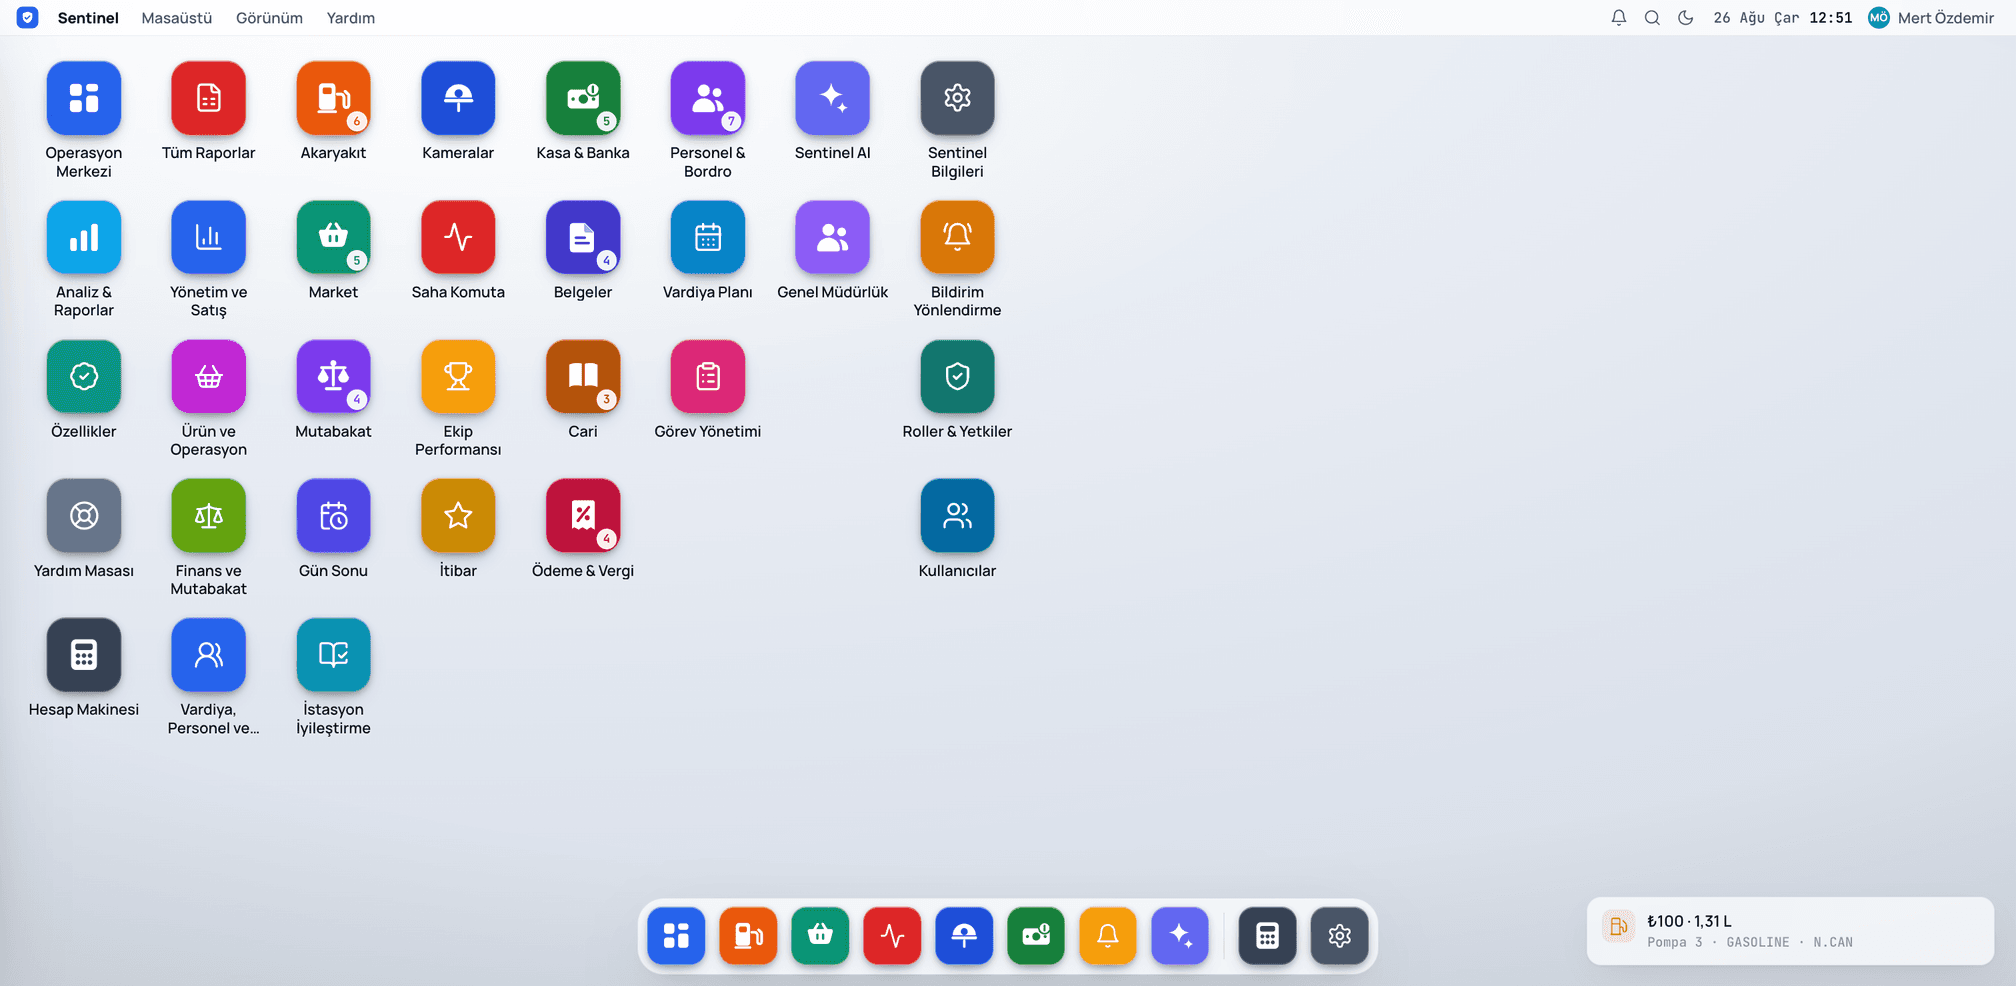
From the tanker delivery to the shift close, the whole station sits on one desktop: eight operational areas, 32 apps, a single data model. Sentinel reads pumps, tanks, the shop, the till, the cameras and the ledger at once, and shows you the gap the same day it opens. The box runs on site; your data never leaves it.
In short
What is Sentinel and what does it do at a fuel station?
Sentinel is the fuel-station management system Neuros builds and runs. It joins pump, tank, shop, till, camera, staff and ledger data in a single data model and presents 32 apps across eight operational areas on one desktop. A pump sale reaches accounting and a camera event reaches staff scoring at the same moment; the ready-made reports in the Report Centre export to Excel for any date range. The box is installed on site, data never goes to the cloud, and fuel operations keep running when the internet drops.
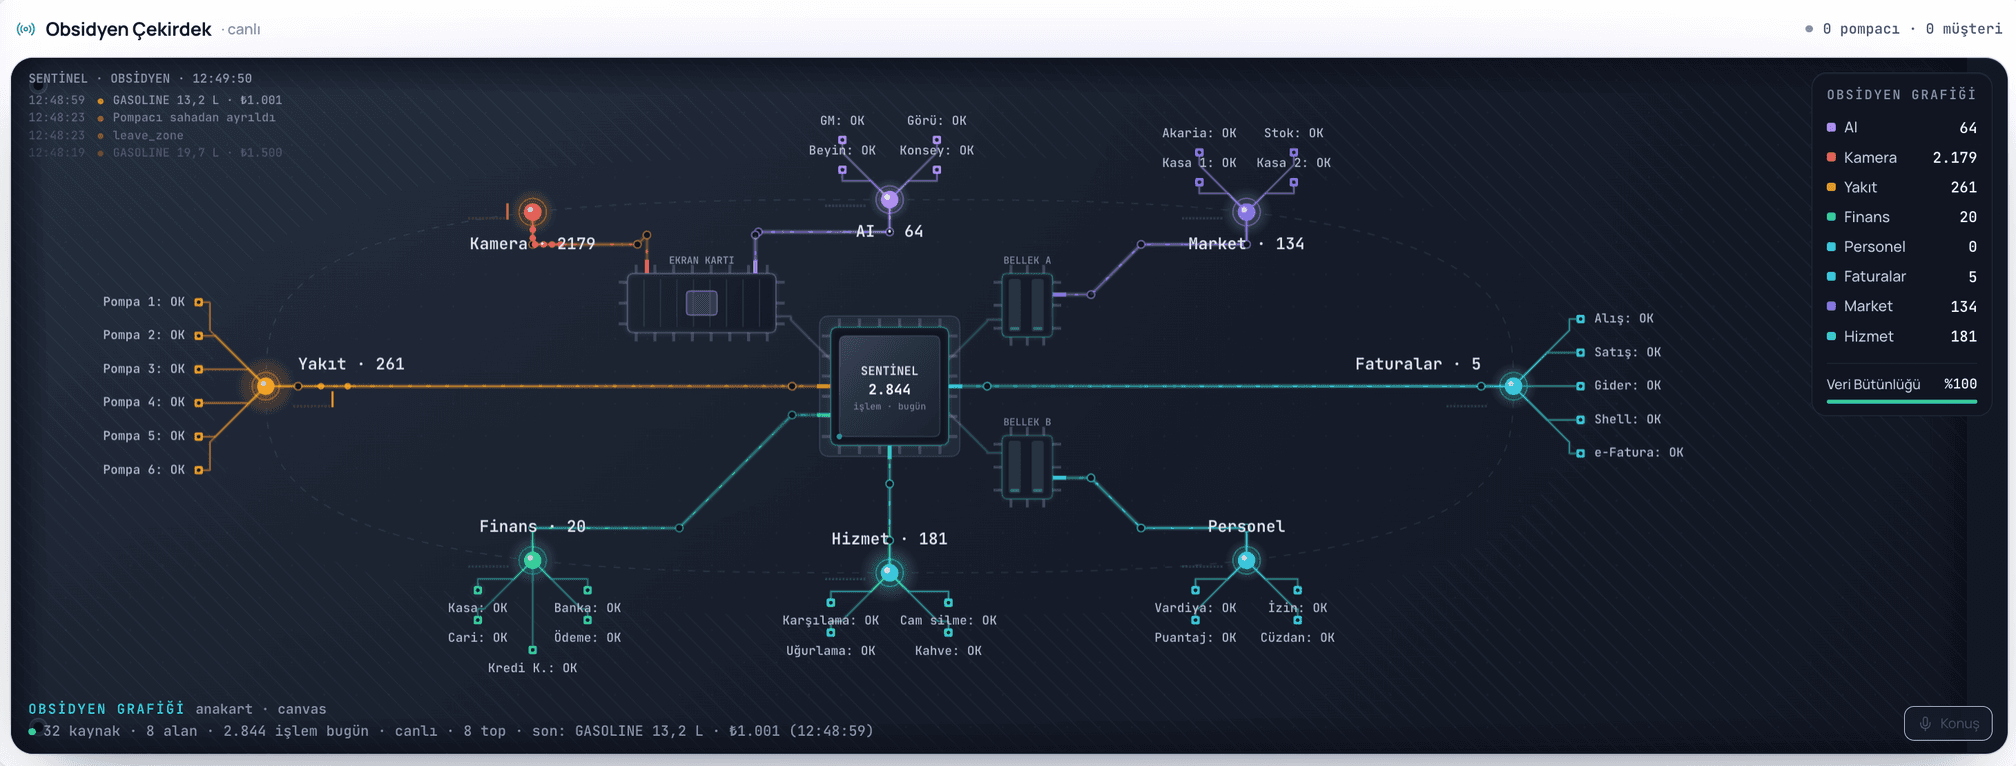
At a fuel station the loss never sits in one place; a gap opens at every handover. Between the litres the tanker discharged and the litres the tank received, between what the pump sold and what the till recorded, between the time spent on the forecourt and the service the customer actually got. Sentinel wires all of those gaps into one data model: eight operational areas — General, Report Centre, Operations, Field, Finance, HR, Sentinel AI and System — gather 32 apps on one desktop, and the Obsidian Core screen draws the transactions moving between those areas as a live graph, so a source going quiet shows up as a broken line. The box is installed on site and connects to TURPAK automation, Akaria POS and the NVR cameras already there; pump readings, till transactions and camera analysis need no outside connection.
The chain
Where the litres travel and where the gap opens
A loss is rarely a moment of theft; it is a measurement gap. An interval opens at every link of the chain and none of them looks large on its own. Because Sentinel measures all four at once, the difference surfaces on the day it opens rather than at month end.
- 01
Tanker
Litres on the docket ↔ litres in the tank
A GPS approach alert arrives, the invoice is read by OCR on delivery, and stock and expense update automatically. What the paperwork says and what the tank measured sit side by side.
- 02
Tank
Gauged level ↔ litres sold
Every tank level is read live and drawn down by the litres sold since the last gauge. A tank at critical level raises a notification, and the day gauge and sales diverge is the day you see it.
- 03
Pump
Metered sale ↔ recorded sale
Sales are read by pump, nozzle and fuel type; the litres coming from the automation match against the receipt and the payment record. Hourly density becomes the basis of the shift plan.
- 04
Till
Expected collection ↔ counted money
Cash, card, bank transfer and credit are totalled separately and reconciled against bank and POS. A shortfall or surplus surfaces with the shift and the person attached: not "the total is off" but where it went off.
Field
Time on the forecourt ↔ service the customer got
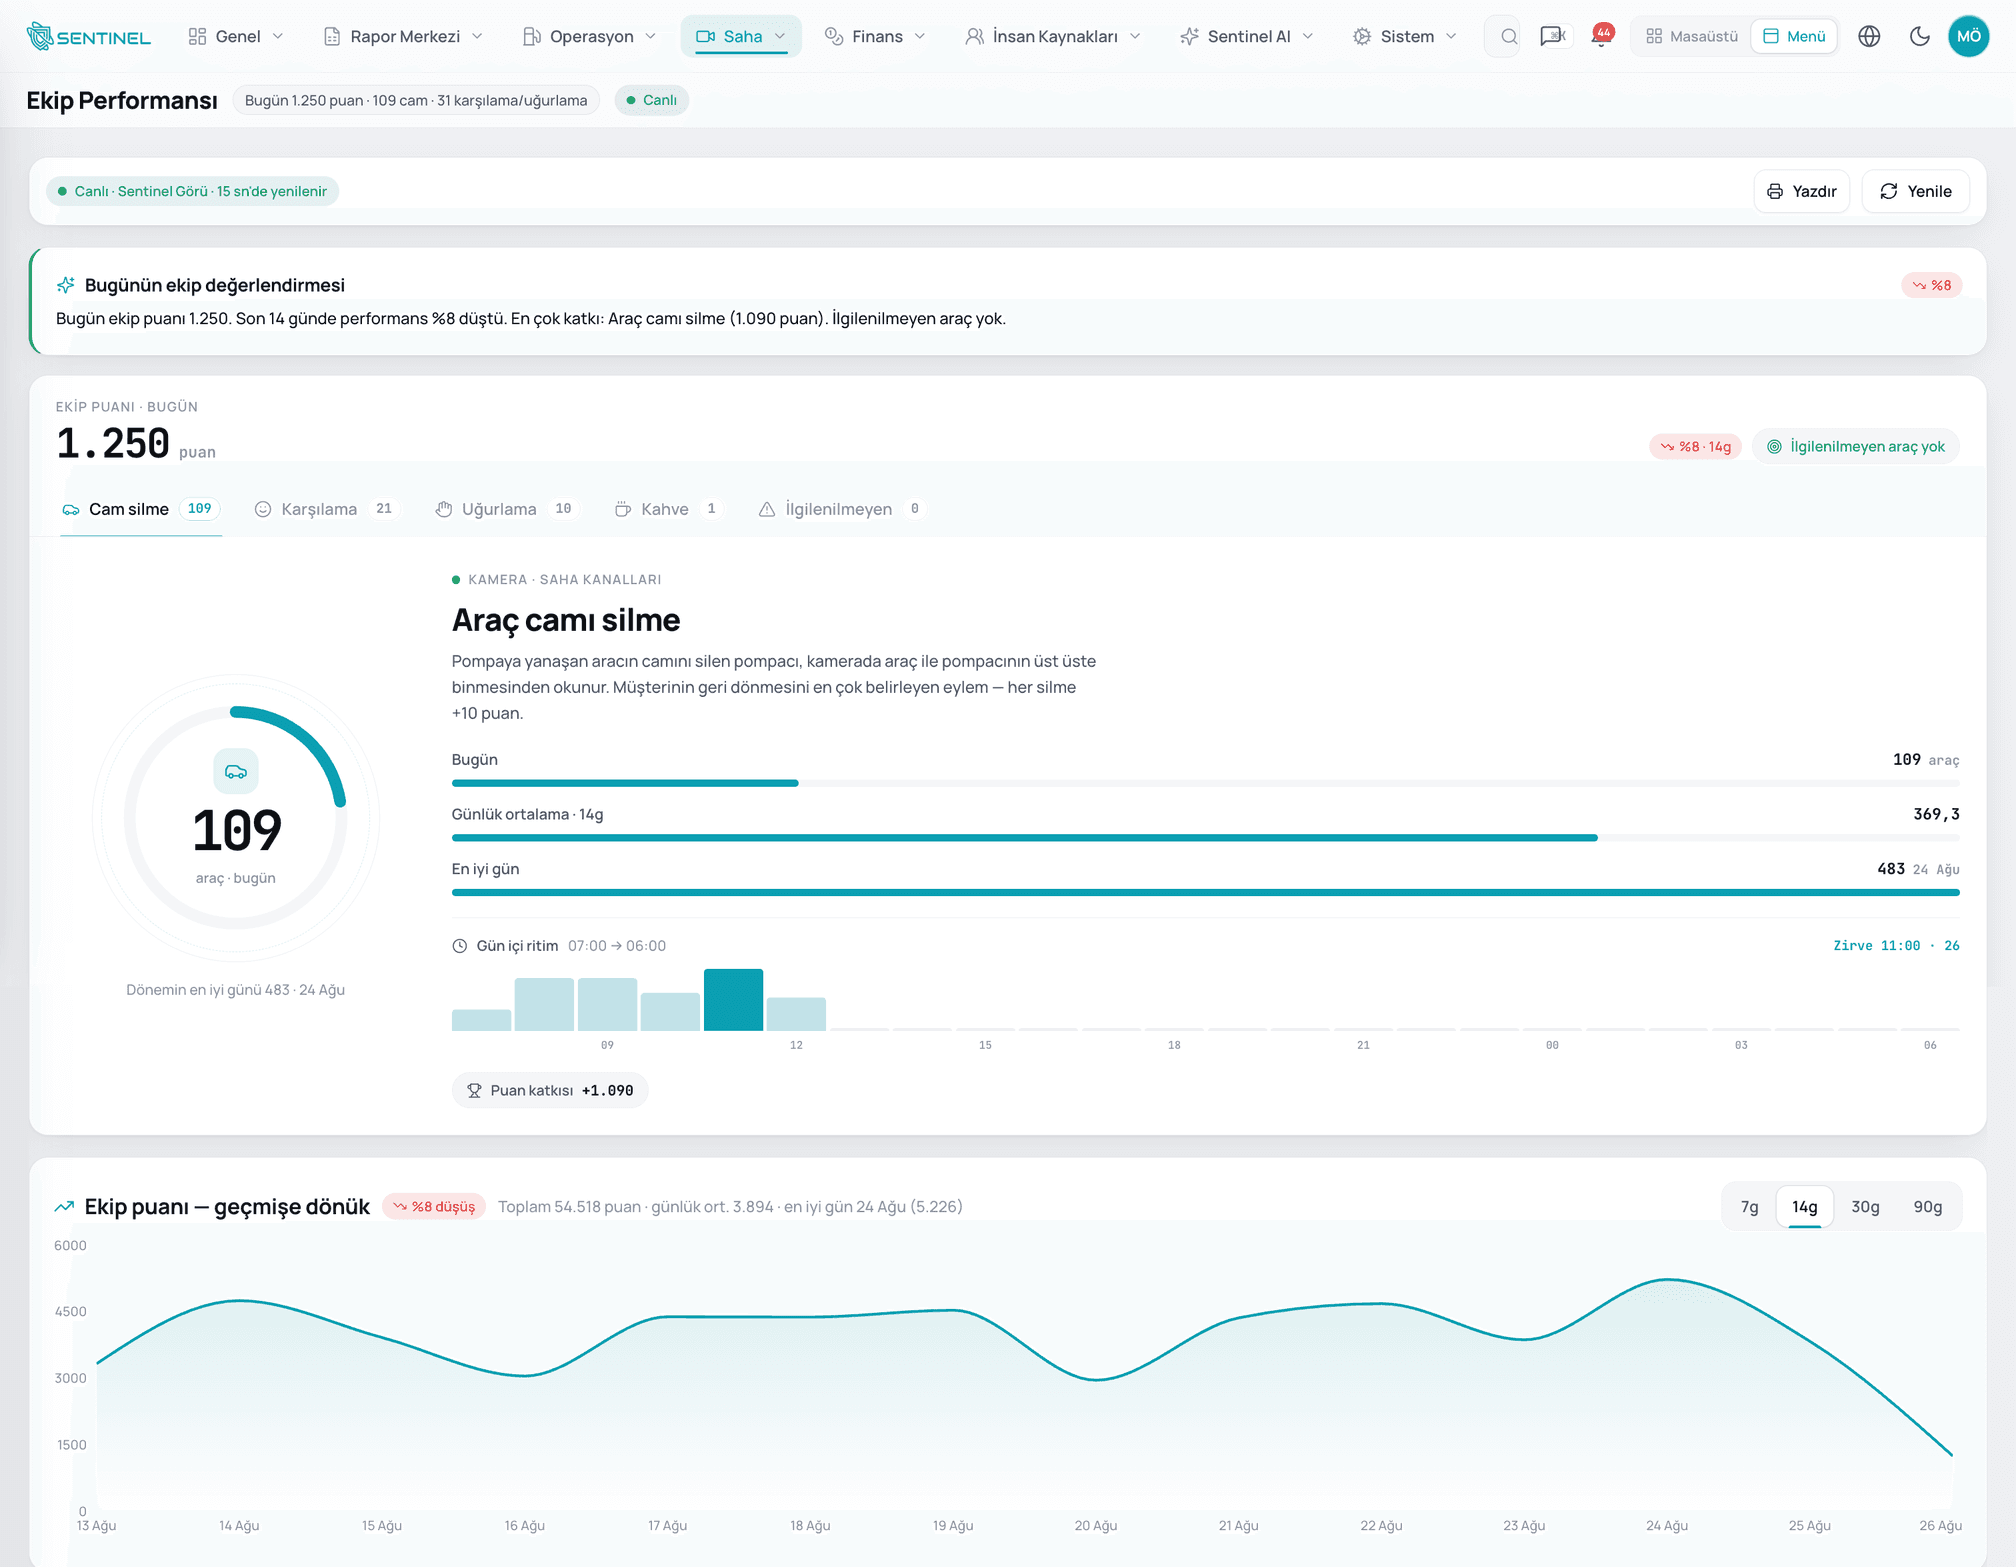
The camera layer sits above the whole chain: greetings, windscreens cleaned, time at the pump and stretches where the forecourt stood empty. Each action carries a score written in advance, and the team score is tracked through the day and backwards.
Modules
What is inside the product
01 · General — Operations Centre
Revenue, litres, receipts, tank levels, forecourt status and the ledger falling due — the station as it stands right now, on one screen. Beneath it the Obsidian Core graph draws the transactions flowing between areas live: if a source goes quiet, you see which line broke.
02 · Report Centre
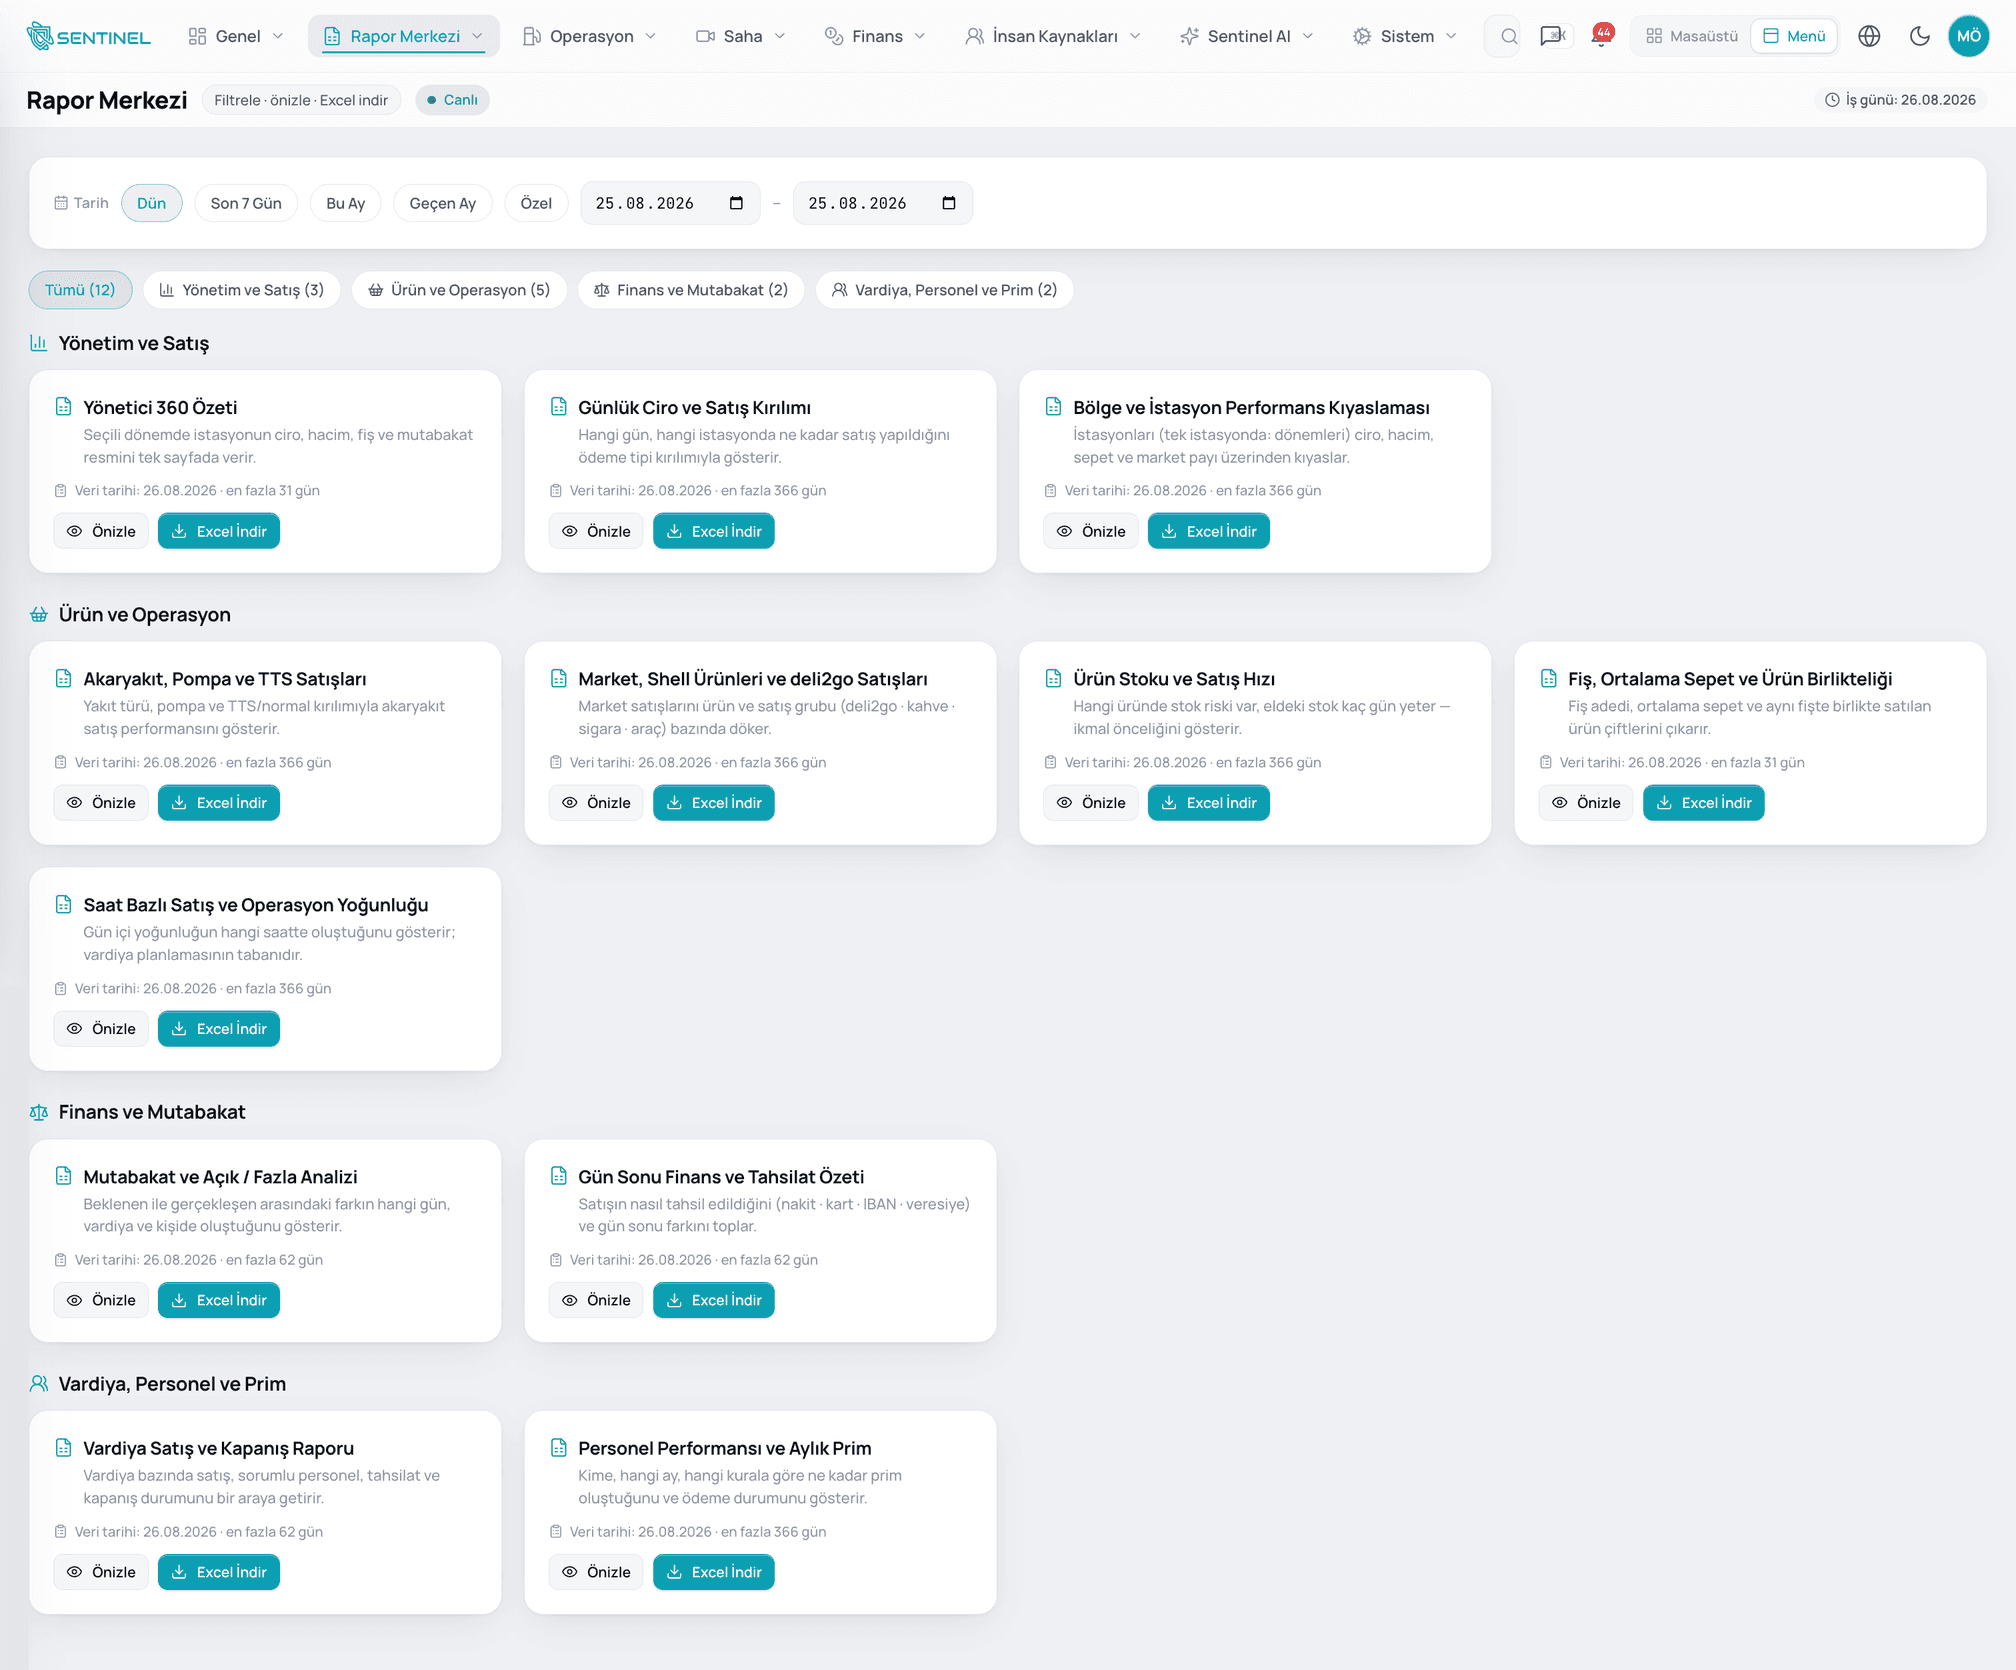
A ready-made report set under management and sales, product and operations, finance and reconciliation, shift and bonus. Pick a date range, preview, export to Excel. Each card states how far back its data reaches.
03 · Operations — fuel & shop
Fuel sales broken out by pump, nozzle and grade; on the shop side, product, stock risk and sell-through. A tank at critical level raises a notification and proposes the tanker order, and "how many days will this stock last" is answered from data rather than from the shelf.
04 · Field — cameras & team performance
The camera records, Sentinel Vision reads: was the customer greeted, was the windscreen cleaned, is the attendant on the forecourt. Each action turns into a defined score and the team score is tracked up to 90 days back. Suspicious movement is a separate track: the system flags, a person decides.
05 · Finance — till, reconciliation, ledger
What the attendant sold is reconciled against what they collected; cash, card, transfer and credit total separately and settle against bank and POS. The gap between expected and actual surfaces with the shift and the person attached, and invoices due and overdue sit in one list.
06 · HR — shifts, payroll, bonus
Shift plan, timesheet, leave and payroll sit on the same data. Sales and service score combine, the bonus rule is written once and entitlement calculates itself. Who earned what, under which rule, is a line in the report.
07 · Sentinel AI — assistant & agents
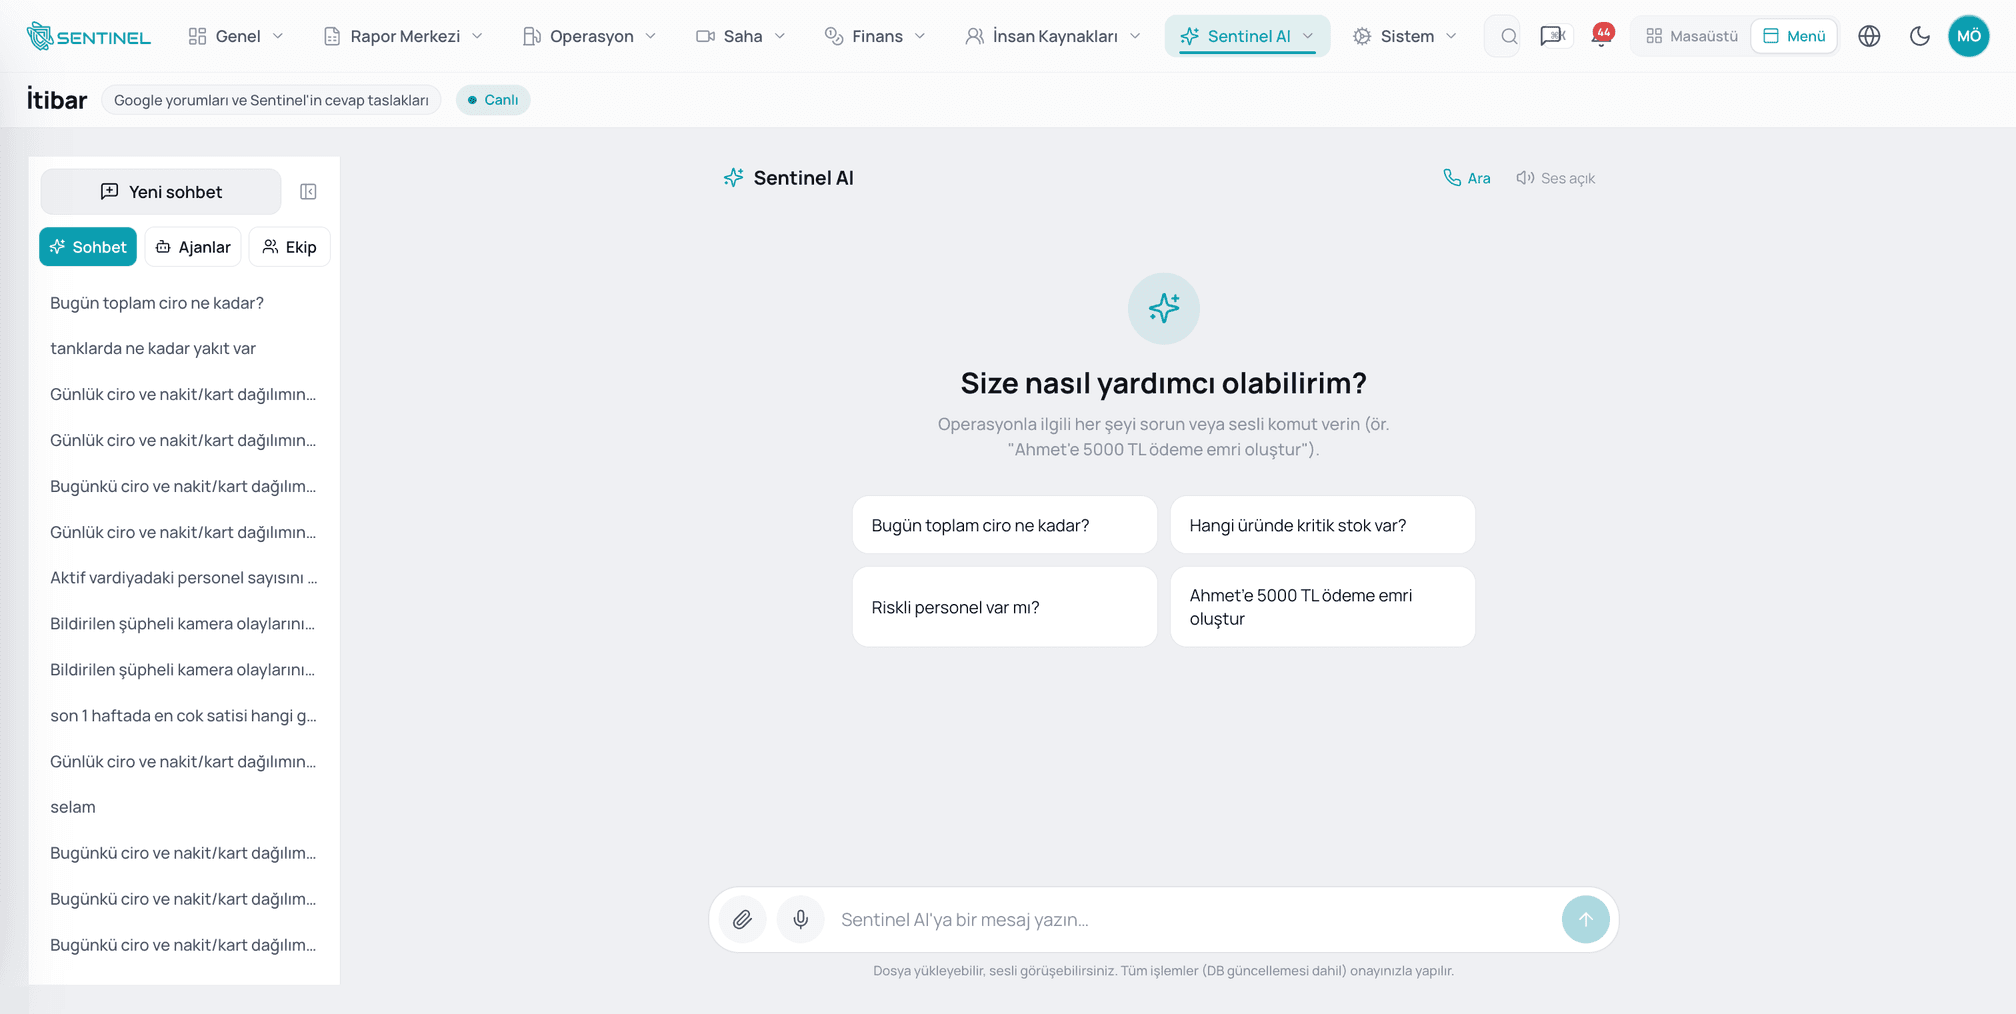
"What is today's revenue?", "Which product is at critical stock?" — ask by voice or text. The assistant runs on the station's own data and can carry out actions such as raising a payment order; every step that changes the database comes to you for approval first. On the reputation side it reads Google reviews and drafts the reply.
08 · System — roles, permissions, notifications
Who sees what, and which event reaches whom: permissions are role-based, notifications are routed by rule. Tank running low, till short, suspicious transaction — each lands on the right phone. In a multi-station setup, region and station read on the same scale.
Features
Your entire station. On one screen.
Your data stays yours
The box runs on site and the database is yours. The cloud is used only for licensing, support and updates, over an outbound connection.
Works without internet
If connectivity drops, fuel operations continue; only the cloud-dependent surfaces degrade temporarily.
Works with your hardware
Runs with TURPAK automation, Akaria POS and the NVR cameras already on site. No new cameras or pumps required.
AI, with a human in the loop
Every step where the assistant changes the database and every event the camera flags passes a human first; the "correct" or "incorrect" verdict goes back into the model.
Multi-station management
Region and station-level permissions, comparative reporting and central inventory tracking.
Installation and training included
Installation runs as a 13-step field process; the team is trained on site across at least three shifts before the station goes live.
Screens
The screenshots come from the product itself — nothing was redrawn for the page.
- 01sentinelops.com.tr
- 02sentinelops.com.tr
- 03sentinelops.com.tr
- 04sentinelops.com.tr
- 05sentinelops.com.tr
The captures come from a running installation. Third-party account names, invoice references and camera stills were blurred before publishing; the structure of the screens and the figures were left as they are.
| Area | Sentinel | Classic station automation |
|---|---|---|
| Where it runs | A box at the station, data stays on site | Usually cloud or a central server |
| Internet outage | Fuel operations continue | Most functions stop |
| Accounting link | A pump sale reaches accounting instantly | Batch transfer at end of day |
| Cameras | Analysis on existing NVR, plus staff scoring | Recording and monitoring only |
| Shift close | The variance shows which shift, which payment type and which person it came from | The total either matches or it does not |
| Reporting | A ready-made set; pick a date range, export to Excel | Fixed outputs, mostly prepared by hand |
| AI | Natural-language questions, camera event detection, human-approved feedback | None |
| Out of scope | Non-fuel retail category management | Varies |
No. Sentinel connects to your existing NVR and IP cameras, reads the stream as it is, and runs the analysis inside the box. A new camera is proposed only where there is a blind spot. The same principle applies to the rest of the hardware: TURPAK automation, Akaria POS and bank POS terminals connect without being replaced.
Yes. The Sentinel box is installed on site and runs on its own database; pump readings, till transactions and camera analysis need no external connection. The internet is used only for multi-station reporting, mobile access and e-invoice submission. When connectivity returns, queued records are sent in order.
Scoring comes from defined actions, not from footage. Measurable behaviours — a windscreen cleaned, a customer greeted, time spent at the pump — are counted, and each carries a score written in advance; team score is visible for the day and up to 90 days back. Suspicious movement is a separate track and produces no accusation: the system flags the event, a responsible person marks it "correct" or "incorrect", and the model trains on that feedback.
From the Report Centre. A ready-made set sits under management and sales, product and operations, finance and reconciliation, shift and bonus; you pick a date range, preview the report and download it as Excel. Each card states how far back its data goes, so a report is never sent with a missing period.
Yes. Each station runs its own box while headquarters sees the summaries from all of them on one dashboard. A regional manager compares stations side by side — shift, litres, till variance and staff score read on the same scale. Because the architecture runs on site, one station losing connectivity does not affect reporting for the others.
Other products
See it running on your own data
Let's set up a 45-minute live demo in a dedicated environment, using your scenario.